
During these months, I had the chance to take a look at Power BI at the enterprise level, juggling advanced requests from hundreds of users and reports. I am impressed by all the features that the developers have rolled out recently, greatly improving both user and creator experiences. However, one should always maintain an impartial critical vision of the tools, no matter how useful they can be. For this reason, I decided to share my thoughts about some features that are currently lacking or require over-complicated solutions (often from third-party tools), in the hope that Microsoft will find them useful when working on Power BI’s development roadmap.
While writing, I found myself lucky as all the points I’ll state are currently edge cases or issues I’ve solved with other solutions. So, I would say that overall, Power BI has reached a level of maturity where it smoothly performs its standard job (data visualization) and provides tons of useful tools, customization, and synergies with the Office suite while being updated monthly.
That being said, there are still a few features that could use some attention. For each point, I’ve included a “📿 Hope level” rating, speculating about the likelihood of these features being implemented in the near future. Please note that these ratings are based on my own personal speculations as of March 2023.
🔢 Basic Version Control
📿 Hope level: 7/10
That’s an old story: .pbix files are binary, so they can’t be easily tracked and compared with git or other versioning systems. It’s ironic that the parent company owns Github, but I suppose priorities differ, as evidenced by the recent announcement of Copilot X with GPT-4. There aren’t many big teams of Power BI developers out there who really need the feature.
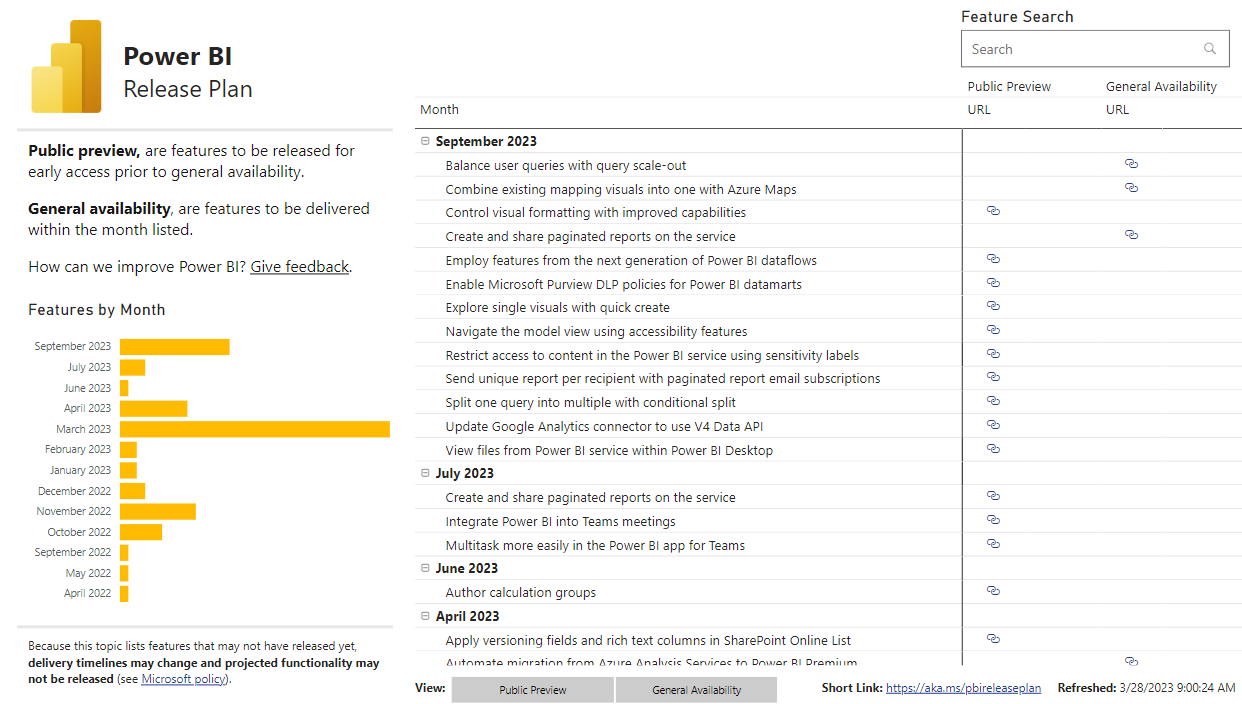
In our situation, this became increasingly frustrating month after month as our models grew larger, and there was still no easy way to compare different versions. I addressed this in another blog post, where I created an over-engineered Azure Pipeline that downloads a third-party tool (Tabular Editor 2) every time, uses it to extract JSON metadata, and commits it together with the model. This allowed us to keep track of parts of the model such as tables, columns, and relationships, but not charts or visuals. Git integration was announced a few weeks ago, then canceled, then supported in an upcoming an upcoming TMDL initiative by SQLBits. While there is still no clear direction defined, things are in motion.
🔘 Enhanced User Input
📿 Hope level: 4/10
An edge case that is more common than expected, especially in the case of forecasts, is the need for users to input one or more values (such as a coefficient of growth) and see live results in Power BI. Currently, this is rather difficult to implement, either with over-engineered Power App solutions or with a combination of tables, what-if parameters, and code (I almost lost my sanity with 100 lines of DAX code).
I wish there were a plugin or chart with a “User Input” feature that includes an input area where users can enter values that will populate live data. However, I understand how complicated this could be at the structural level and that it may not be worth the effort for an edge case. Moreover, Power BI is primarily a data visualization tool, so this is not exactly what we can expect from it.
Microsoft has partially addressed this with the Analyze in Excel feature: it is now easier to connect the dataset to Excel and create ad-hoc formulas from there. While waiting for a native Power BI solution, let’s stick to using Excel.
🧰 Developer tools
📿 Hope level: 6/10
Compared to other Microsoft products such as TypeScript or Playwright, Power BI lacks some basic developer-friendly plugins. This is mostly due to the fact that BI developers who need them represent a small niche. However, as someone who comes from other languages nd uses VS Code all the time, I find the lack of support for my daily activities rather surprising, especially when dealing with messy DAX queries (Power BI’s scripting language, inspired by Excel’s formula language).
I don’t like DAX, and sometimes I feel like giving up on it. Microsoft doesn’t really provide me with anything to improve my experience when writing queries that are more than two lines long. Poor DAX doesn’t even have a logo!
Luckily, I rarely have to create long DAX queries in Power BI. The majority of calculation logic is in the data warehouse, but sometimes there are edge cases that require ad-hoc DAX measures of multiple lines.
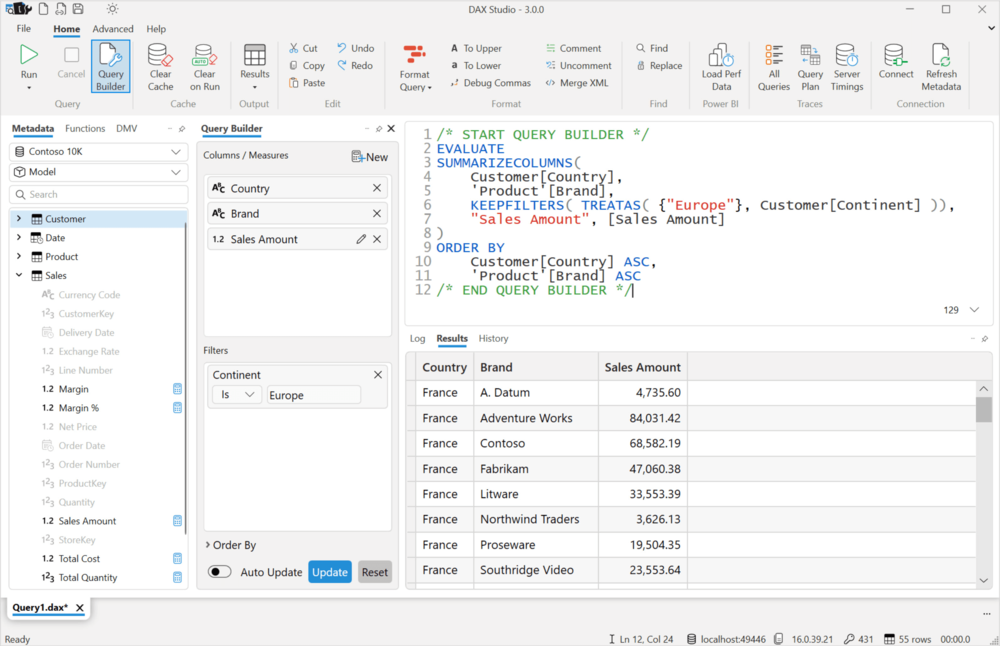
Creating them in the Power BI tab is only suitable if you like to become frustrated with debugging. The simplest solution is another third-party tool, DAX Studio by SQLBI, which enables syntax highlighting, formatting, linting, quick access to documentation, and rather simple debugging. I highly recommend DAX Studio, which is a wonderful and open-source tool. However, considering that Microsoft owns VS Code, I am waiting for some DAX-compatible extensions to better integrate my workflow.
📄 Intermediate-level Documentation
📿 Hope level: 2/10
This is a struggle I am having with Microsoft in general, as its documentation spectacularly manages to overcomplicate even simple concepts. In my opinion, Microsoft docs are great for advanced users who can understand all the technical jargon that is taken for granted, but for beginners or even intermediate developers, this can be overwhelming.
For beginners, I recommend dax.guide from the SQLBI team. Just compare their COUNT example with the one on Microsoft.com for understanding what each function does and how it works. They provide examples, working code, clear explanations of the cases, and links to other concepts.
For the majority of intermediate doubts, such as row/filter context, data connectors, and small DAX formulas, it is still quicker to look at the Power BI forums or YouTube videos, for example from Guy In A Cube.
Learn.microsoft.com remains my last hope when I’m looking for documentation, even though I consider myself an advanced user. I wish that Microsoft would simplify the website for less technical users. Luckily, the web is full of useful and informative third-party sources.
📈 Composite model
📿 Hope level: 8/10
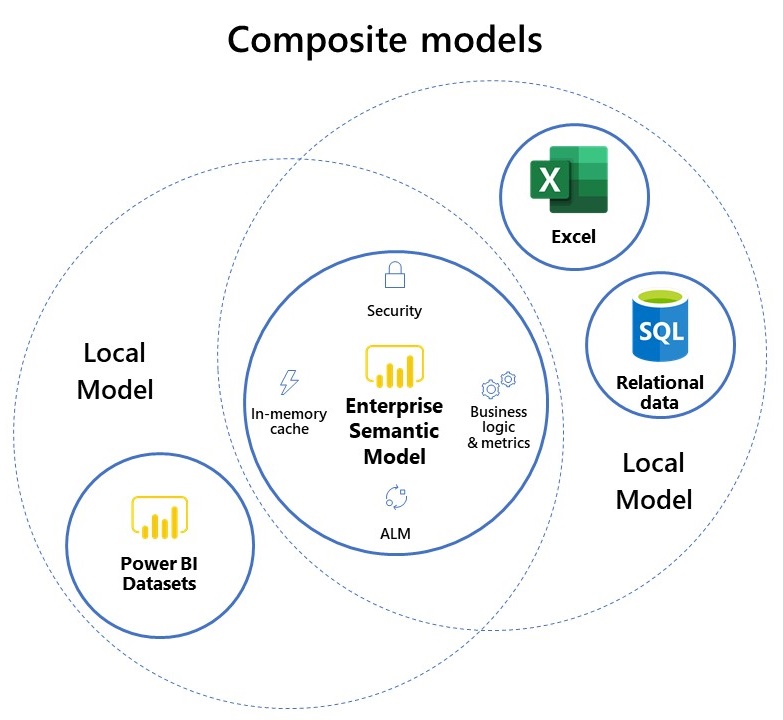
Another experimental feature from Power BI that has been giving me a bit of a headache lately is the Composite Model. Don’t get me wrong, it’s a game changer as it makes it possible to provide a central Power BI dataset with all the data and security rules enabled, which creators can then use as a source and merge with their own data (usually Excel files).
This is very cool, as it replaces and simplifies many manual processes while giving lots of power to secondary report creators. However, it’s still an experimental feature that requires a bit of tricky (and badly documented) steps for working on the Power BI Service, while on Desktop it is pretty straightforward. Here are some issues I’ve encountered:
- Viewers need Build Permissions to all the underlying datasets (which could be a security issue)
- Apparently, RLS impersonation gets screwed up. I tried to impersonate users, and I was able to look at all the data (but in reality, they can’t)
- If the original dataset has a gateway, we have to set up credentials on all the Composite Model datasets and map everything on the gateway
- Creators can’t add calculated columns or tables to the tables from the original dataset, which blocks many custom logic requirements
Even though the Composite Model is a great starting point, it still requires some tweaks to achieve before it can be adopted fully.
🤖 AI-enhanced capabilities
📿 Hope level: 9/10
I wrote the final line just to tag the post with #chatgpt and #agi for boosting views. Joking!
I am curious to see how Microsoft will implement Open AI’s tool in Power BI, as the current options are a bit limited in terms of UX experience. Yes, there is the Q&A feature, but it hasn’t clicked with me as it’s not “that” smart or intuitive at the moment.
I wouldn’t be surprised to see a ChatGPT-like prompt where users can type their questions and receive quick replies, charts, or even help with applying filters or manipulating tables. If the system can be tweaked with external documentations and ad-hoc instructions (now possible with the Retrieval Plugin), it will make Power BI much more powerful for helping people discover new data and information.
Given the current hype and excitement for AI, I’m confident that Microsoft will adapt Copilot’s features in Power BI and work some magic. It’s the perfect time.