I want to express my gratitude for the positive feedbacks I received a few months ago when I used Google Maps data to determine the best times for the daily commute. TL;DR: Mondays are the best, while Wednesdays, and early Fridays are the trickiest times to hit the road.
However, the neatness of this analysis takes a hit when real-world unpredictabilities come into play. Things like heavy traffic, rain, road closures due to accidents, or just that one slow driver in front of you can disrupt even the best-planned routes. So, it’s essential to view these explorations as “what if” games. They provide a general framework but can’t fully account for the chaos of everyday life.
For a while, I contemplated adding weather data to show how rainy days significantly affect commute times, not to mention snowy days. The problem is, predicting tomorrow’s weather is challenging, and my initial hypothesis was already on shaky ground. Empirical evidence reveals anyway that the worse the weather, the worse the commute.
Instead, I decided to explore something more intriguing: car accidents. These are the “black swans” of road trip planning—unexpected events that can ruin your day and disrupt any carefully calculated commute. Unfortunately, we can’t predict or prevent them, but by understanding when accidents are more likely, we can at least be more informed. In this analysis, I will focus on my coordinates in the Swiss area, but I’ll provide the code on my Github so you can investigate car accident data yourself. The best part? No Google key is required this time.
📦 Gathering and Preparing the Data
The most challenging part, I assumed, would be acquiring the data. But to my surprise, the Swiss government offers an interactive dashboard and a link for exporting all the data (direct download). Within minutes, I had a decade’s worth of Swiss car accident data downloaded, ready to crunch some numbers.
The data proved to be relatively clean, featuring columns in French, Italian, German, and English, detailing accident types, road types, weekdays, and hours (though not exact dates for privacy). As a newcomer in this field, my major challenge was deciphering the creators’ peculiar method of measuring latitudes and longitudes, which was based on the center on the country rather than as the standard, on the Earth’s center of mass. Those Location_CHLV95 fields threw me off at first, but after some exploration, I managed to convert the coordinates from EPSG:2056 (the “Swiss” method) to the Standard World Geodetic System, using the pyproj library.
The last steps involved filtering the coordinates to focus only on my commute area, and I was ready to explore the results.
📊 A Peek with Power BI
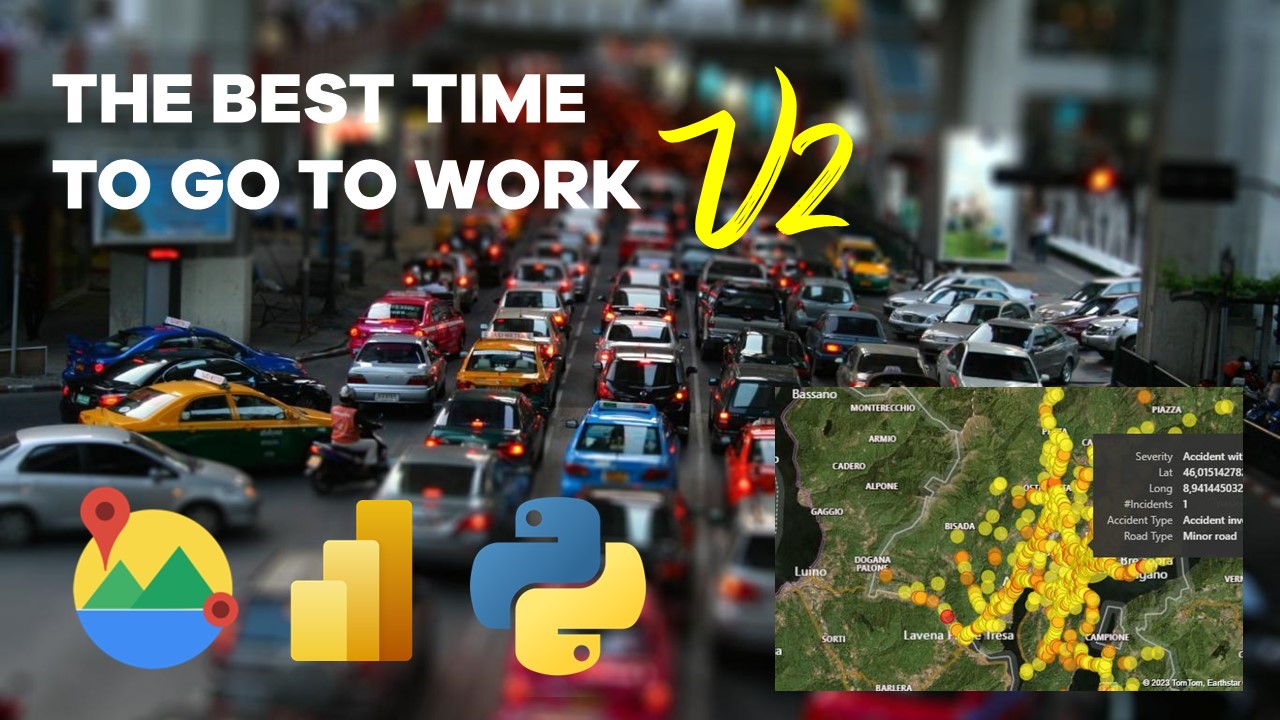
Instead of relying solely on Python’s seaborn for data visualization, I turned to a more potent tool I use in my daily job, Microsoft Power BI (I already wrote about it here). My first task was to create a map of accidents, color-coded by severity, much like the one on the Swiss website.
Now, let’s delve into the aggregated data (still filtered to my commute area). Surprisingly, the risk of accidents is lowest during the morning, gradually increasing to peak during the evening rush hour. Among the weekdays, Tuesday stands out slightly, though it’s a minor fluctuation. As for Mondays, they consistently prove to be the least congested days during my commute. So if you’re one of those who despise Mondays, here’s a valid reason to find joy: it’s the safest weekday!
But my data spans over the past 11 years, and many changes have occurred on our roads during that time. If we consider only the post-COVID years, the trend appears more random. It seems that the data isn’t sufficient for drawing precise conclusions. Mondays continue to show fewer accidents, though, offering some statistical redemption for the most loathed day of the week.
Speaking of recent years, let’s conclude the analysis with an encouraging chart: the trend over the years. Since 2010, car accidents on both my commute route and the entire region have decreased by half. This indicates not only safer roads but also saved lives, a result of (my guess) a combination of stricter speed limits, advancements in automotive safety, and increased awareness of road safety issues. It’s truly heartening news.
🤔 Final Thoughts
- My updated analysis reaffirms that Mondays are statistically better for commuting, and avoiding peak hours whenever possible is obviously a wise choice, both mentally and phisically speaking.
- Focusing on the most recent years, the risk of accidents appears random and challenging to predict on a day-to-day basis. However, accidents are notably more likely during the evening rush hour, around 6 PM (+100% risk increase).
- My assumption that people are sleepier in the morning, increasing the risk of accidents, doesn’t hold up in this data.
- The gradual decrease in car accidents over the years is excellent news for all commuters.
With this update, I can better assess the safety of each day and make informed decisions, like avoiding working from home on Mondays. It was a rewarding experience delving into the Swiss dataset, and I hope that these findings will contribute to improving road safety and security in our country. Let’s see if I can unearth more data to refine my analysis further!